ML | Decision Tree Algorithm & Code using Python.

Decision Tree
Decision tree is one of the most popular machine learning algorithms used all along, This story I wanna talk about it so let’s get started!!!
Decision trees are used for both classification and regression problems, this story we talk about classification.
Before we dive into it , let me ask you this
Why Decision Tree?
We have couple of other algorithms there, so why do we have to choose Decision trees??
well, there might be many reasons but I believe a few which are
- Decision tress often mimic the human level thinking so its so simple to understand the data and make some good interpretations.
- Decision trees actually make you see the logic for the data to interpret(not like black box algorithms like SVM, NN, etc..)
For example : if we are classifying bank loan application for a customer, the decision tree may look like this
Here we can see the logic how it is making the decision.
It’s simple and clear.

So what is the decision tree??
A decision tree is a tree where each node represents a feature(attribute), each link(branch) represents a decision(rule) and each leaf represents an outcome(categorical or continues value).
The whole idea is to create a tree like this for the entire data and process a single outcome at every leaf(or minimize the error in every leaf).

Okay so how to build this??
There are couple of algorithms there to build a decision tree , we only talk about a few which are
- CART (Classification and Regression Trees) → uses Gini Index(Classification) as metric.
- ID3 (Iterative Dichotomiser 3) → uses Entropy function and Information gain as metrics.
Lets just first build decision tree for classification problem using above algorithms,
Classification with using the ID3 Algorithm.
Let’s just take a famous dataset in the machine learning world which is weather dataset(playing game Y or N based on weather condition).
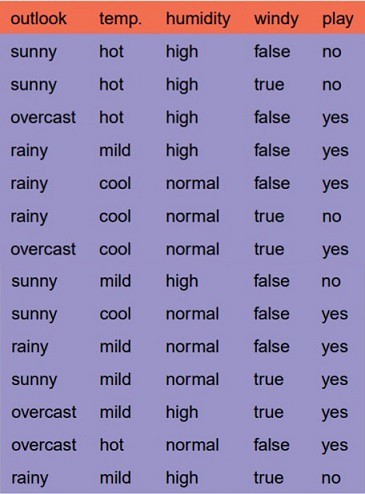
We have four X values (outlook,temp,humidity and windy) being categorical and one y value (play Y or N) also being categorical.
so we need to learn the mapping (what machine learning always does) between X and y.
This is a binary classification problem, lets build the tree using the ID3 algorithm
To create a tree, we need to have a root node first and we know that nodes are features/attributes(outlook,temp,humidity and windy),
Answer: determine the attribute that best classifies the training data; use this attribute at the root of the tree. Repeat this process at for each branch.
This means we are performing top-down, greedy search through the space of possible decision trees.
In order to define information gain precisely, we begin by defining a measure commonly used in information theory, called entropy that characterizes the (im)purity of an arbitrary collection of examples.”

For a binary classification problem
- If all examples are positive or all are negative then entropy will be zero i.e, low.
- If half of the examples are of positive class and half are of negative class then entropy is one i.e, high.

Okay lets apply these metrics to our dataset to split the data(getting the root node)
Steps:
1.compute the entropy for data-set2.for every attribute/feature:
       1.calculate entropy for all categorical values
       2.take average information entropy for the current attribute
       3.calculate gain for the current attribute3. pick the highest gain attribute.
4. Repeat until we get the tree we desired.
What the heck???
Okay I got it , if it does not make sense to you , let me make it sense to you.
Compute the entropy for the weather data set:
Compute the entropy for the weather data set:

For every feature calculate the entropy and information gain

Similary we can calculate for other two attributes(Humidity and Temp).
Pick the highest gain attribute.

So our root node is Outlook.

Repeat the same thing for sub-trees till we get the tree.

Classification with using the CART Algorithm:
In CART we use Gini index as a metric,
We use the Gini Index as our cost function used to evaluate splits in the dataset.
our target variable is Binary variable which means it take two values (Yes and No). There can be 4 combinations.
Actual=1 predicted 1
1 0 , 0,1, 0 0P(Target=1).P(Target=1) + P(Target=1).P(Target=0) + P(Target=0).P(Target=1) + P(Target=0).P(Target=0) = 1P(Target=1).P(Target=0) + P(Target=0).P(Target=1) = 1 — P^2(Target=0) — P^2(Target=1)
Gini Index for Binary Target variable is
= 1 — P^2(Target=0) — P^2(Target=1)

A Gini score gives an idea of how good a split is by how mixed the classes are in the two groups created by the split. A perfect separation results in a Gini score of 0, whereas the worst case split that results in 50/50 classes.
We calculate it for every row and split the data accordingly in our binary tree. We repeat this process recursively.
For Binary Target variable, Max Gini Index value
= 1 — (1/2)^2 — (1/2)^2
= 1–2*(1/2)^2= 1- 2*(1/4)
= 1–0.5
= 0.5
Similarly if Target Variable is categorical variable with multiple levels, the Gini Index will be still similar. If Target variable takes k different values, the Gini Index will be

Maximum value of Gini Index could be when all target values are equally distributed.
Similarly for Nominal variable with k level, the maximum value Gini Index is
= 1–1/k
Minimum value of Gini Index will be 0 when all observations belong to one label.
Similarly for Nominal variable with k level, the maximum value Gini Index is
= 1–1/k
Minimum value of Gini Index will be 0 when all observations belong to one label.
Steps:
1.compute the gini index for data-set2.for every attribute/feature:
       1.calculate gini index for all categorical values
       2.take average information entropy for the current attribute
       3.calculate the gini gain3. pick the best gini gain attribute.
4. Repeat until we get the tree we desired.
The calculations are similar to ID3 ,except the formula changes.
for example :compute gini index for dataset


similarly we can follow other steps to build the trees.

Final Tree With All the Formulas.

Code For Decision Tree:

Recommended Blogs:
2. Machine Learning for beginners. ( Click )
3. ML | Linear Regression using Python ( Click )
3. ML | Linear Regression using Python ( Click )
Want to Fill Your IT Career GAP? If you looking for the Best Certified and Trustable Experience Certificate Provider in Chennai, India So There are Lots of Consultancy Here But Dreamsoft Consultancy is The Best Consultancy.
ReplyDeleteExperience Certificate Provider in Chennai- The Career of Your Life
Experience Certificate Provider in Bangalore- Once Driven, Forever Career